Version 1.0.5 of the CDK descriptor calculator is now available. This version updates the command line batch mode to allow one to calculate a specific set of descriptors (as opposed to all or say, topological). The selected descriptors are specified using an XML file, which can be generated in the GUI mode – fire up the calculator in GUI mode, check the selected descriptors and then save the selection. You can then specify the selection file via the -s option.
Update to the fingerprint Package
I’ve just uploaded a new version of the fingerprint package (v3.3) to CRAN that implements some ideas described in Nisius and Bajorath. First, the balance method generates “balanced code” fingerprints, which given an input fingerprint of N bits, returns a new fingerprint of 2N bits, such that the bit density is exactly 50%. Second, bit.importance is a method to evaluate the importance of each bit in a fingerprint, in terms of the Kullback-Liebler divergence between a collection of actives and background molecules. In other words, the method ranks the bits in terms of their ability to discriminate between the actives and the background molecules.
Some More Comparisons with the GSK Dataset
My previous post did a quick comparison of the GSK anti-malarial screening dataset with a virtual library of Ugi products. That comparison was based on the PubChem fingerprints and indicated a broad degree of overlap. I was also interested in looking at the overlap in other feature spaces. The simplest way to do this is to evaluate a set of descriptors and then perform a principal components analysis. We can then plot the first two principal components to get an idea of the distribution of the compounds in the defined space.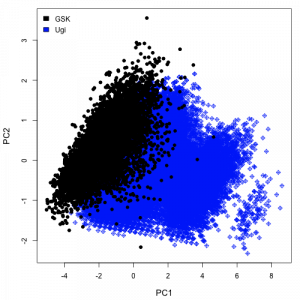
I evaluated a number of descriptors using the CDK. In a physicochemical space represented by the number of rotatable bonds, molecular weight and XlogP values, a plot of the first two principal components looks as shown on the right. Given the large number of points, the plot is more of a blob, but does highlight the fact that there is a good degree of overlap between the two datasets. On going to a BCUT space on the left, we get a different picture, stressing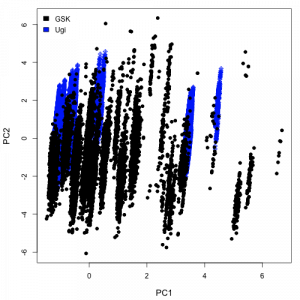 the greater diversity of the GSK dataset. Of course, these are arbitary descriptor spaces and not necessarily meaningful. One would probably choose a descriptor space based on the problem at hand (and also the CDK XlogP implementation probably needs some work).
I was also interested in the promiscuity of the compounds in the GSK dataset. Promiscuity is the phenomenon where a molecule shows activity in multiple assays. Promiscuous activity could be indicate that the compound is truly active in all or most of the assays (i.e., hitting multiple distinct targets), but could also indicate that the activity is artifactual (such as if it were an aggregator or flourescent compound).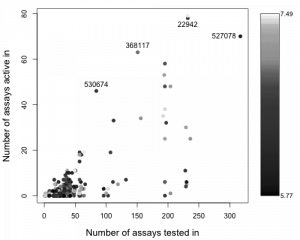
This analysis is performed by looking for those GSK molecules that are in the NCGC collection (272 exact matches) and checking to see how many NCGC assays they are tested in and whether they were active or not. Rather than look at all assays in the NCGC collection, I consider a subset of approximately 1300 assays curated by a colleague. Ideally, a compound will be active in only one (or a few) of the assays it is tested in.
For simplicities sake, I just plot the number of assays a compound is tested in versus the number of them that it is active in. The plot is colored by the activity (pXC50 value in the GSK SD file) so that more potent molecules are lighter.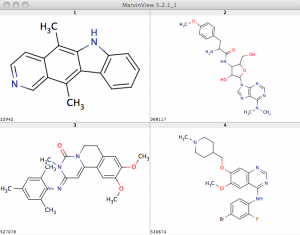 While the bulk of these molecules do not show significant promiscuous activity, a few of them do lie at the upper range. I’ve annotated four and their structures are shown below. Compound 530674 appears to be quite promiscuous given that it is active in 46 out of 84 assays it’s been tested in at the NCGC. On the other hand, 22942 is tested in 232 assays but is activity in 78 of them. This could be considered a low ratio, and isoquinolines have been noted to be non-promiscuous. (Both of these target kinases as noted in Gamo et al).
A Quick Look at the GSK Malaria Dataset
A few days ago, GSK released an approximately 13,000 member compound library (using the CC0 license) that had been tested for activity against P. falciparum. The structures and data have been deposited into ChEMBL and a paper is available, that describes the screening project and results. Following this announcement there was a thread on FriendFeed, where Jean-Claude Bradley suggested that it might be useful to compare the GSK library with a virtual library of about 117,000 Ugi compounds that he’s been using in the Open Notebook malaria project.
There are many ways to do this type of comparison – ranging from a pairwise similarity search to looking at the overlap of the distribution of compound properties in some pre-defined descriptor space. Given the size of the datasets, I decided to look at a faster, but cruder option using the idea of bit spectra, which is essentially the normalized frequency of bits in a binary fingerprint across a dataset.
I evaluated the 881-bit PubChem fingerprints for the two datasets using the CDK and then evaluated the bit spectra using the fingerprint package in R. We can then compare the datasets (at least in terms of the PubChem fingerprint features) by plotting the bit spectra. 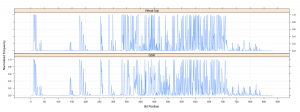 The two spectra are pretty similar, suggesting very similar distributions of functional groups. However there are a number of differences. For example, for bit positions 145 – 155, the GSK library has a higher occurrence than the Ugi library. These features focus on various types of 5-member rings. Another region of difference occurs around bit position 300 and then around positions 350-375.
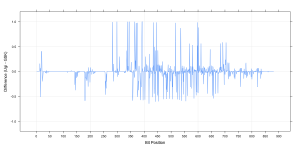
The static visualization shown here is a simple summary of the similarity of the datasets, but with appropriate interactive graphics one could easily focus on the specific regions of interest. Another way would be to evaluate the difference spectrum and quickly identify features that are more prevalent in the Ugi library compared to the GSK library (i.e., positive values in the plot shown here) and vice versa.
New Version of rcdk
Based on feedback from the recent R workshop at the EBI, I’ve updated the rcdk package to include more methods operating on atoms, a modification to parse.smiles to allow it to handle a vector of SMILES strings, which makes it more R-like (thanks to Tobias Verbeke for the patch). In addition, one can now load very large SMILES or SDF files using the iterating readers from the CDK. This feature makes use of the iterators package and lets you write code such as
1 2 3 4 5 | iter <- iload.molecules('big.smi', type='smi') while(hasNext(iter)) { mol <- nextElem(iter) print(get.property(mol, "cdk:Title") } |
As a result, only one molecule is loaded at a time, allowing one to process arbitrarily large files. Version 2.9.23 has been uploaded to CRAN and should be available in a day or two