My previous post did a quick comparison of the GSK anti-malarial screening dataset with a virtual library of Ugi products. That comparison was based on the PubChem fingerprints and indicated a broad degree of overlap. I was also interested in looking at the overlap in other feature spaces. The simplest way to do this is to evaluate a set of descriptors and then perform a principal components analysis. We can then plot the first two principal components to get an idea of the distribution of the compounds in the defined space.
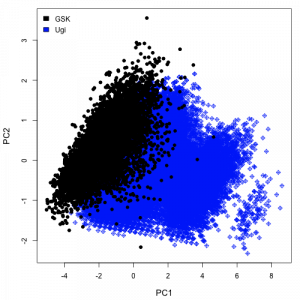
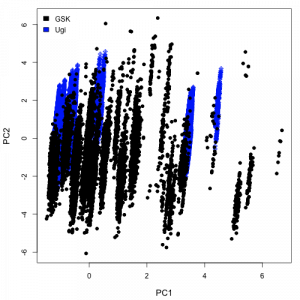
I evaluated a number of descriptors using the CDK. In a physicochemical space represented by the number of rotatable bonds, molecular weight and XlogP values, a plot of the first two principal components looks as shown on the right. Given the large number of points, the plot is more of a blob, but does highlight the fact that there is a good degree of overlap between the two datasets. On going to a BCUT space on the left, we get a different picture, stressing the greater diversity of the GSK dataset. Of course, these are arbitary descriptor spaces and not necessarily meaningful. One would probably choose a descriptor space based on the problem at hand (and also the CDK XlogP implementation probably needs some work).
I was also interested in the promiscuity of the compounds in the GSK dataset. Promiscuity is the phenomenon where a molecule shows activity in multiple assays. Promiscuous activity could be indicate that the compound is truly active in all or most of the assays (i.e., hitting multiple distinct targets), but could also indicate that the activity is artifactual (such as if it were an aggregator or flourescent compound).
This analysis is performed by looking for those GSK molecules that are in the NCGC collection (272 exact matches) and checking to see how many NCGC assays they are tested in and whether they were active or not. Rather than look at all assays in the NCGC collection, I consider a subset of approximately 1300 assays curated by a colleague. Ideally, a compound will be active in only one (or a few) of the assays it is tested in.
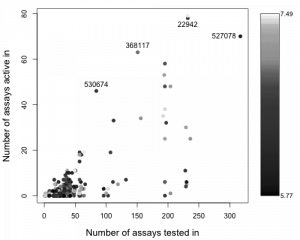
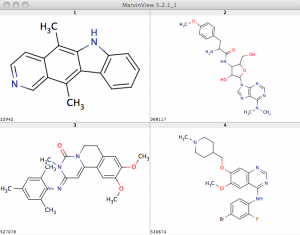
For simplicities sake, I just plot the number of assays a compound is tested in versus the number of them that it is active in. The plot is colored by the activity (pXC50 value in the GSK SD file) so that more potent molecules are lighter. While the bulk of these molecules do not show significant promiscuous activity, a few of them do lie at the upper range. I’ve annotated four and their structures are shown below. Compound 530674 appears to be quite promiscuous given that it is active in 46 out of 84 assays it’s been tested in at the NCGC. On the other hand, 22942 is tested in 232 assays but is activity in 78 of them. This could be considered a low ratio, and isoquinolines have been noted to be non-promiscuous. (Both of these target kinases as noted in Gamo et al).