A few days ago, GSK released an approximately 13,000 member compound library (using the CC0 license) that had been tested for activity against P. falciparum. The structures and data have been deposited into ChEMBL and a paper is available, that describes the screening project and results. Following this announcement there was a thread on FriendFeed, where Jean-Claude Bradley suggested that it might be useful to compare the GSK library with a virtual library of about 117,000 Ugi compounds that he’s been using in the Open Notebook malaria project.
There are many ways to do this type of comparison – ranging from a pairwise similarity search to looking at the overlap of the distribution of compound properties in some pre-defined descriptor space. Given the size of the datasets, I decided to look at a faster, but cruder option using the idea of bit spectra, which is essentially the normalized frequency of bits in a binary fingerprint across a dataset.
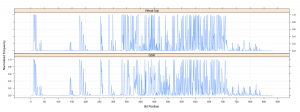
I evaluated the 881-bit PubChem fingerprints for the two datasets using the CDK and then evaluated the bit spectra using the fingerprint package in R. We can then compare the datasets (at least in terms of the PubChem fingerprint features) by plotting the bit spectra.  The two spectra are pretty similar, suggesting very similar distributions of functional groups. However there are a number of differences. For example, for bit positions 145 – 155, the GSK library has a higher occurrence than the Ugi library. These features focus on various types of 5-member rings. Another region of difference occurs around bit position 300 and then around positions 350-375.
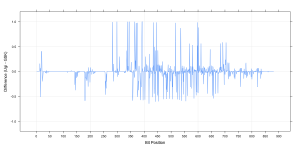
The static visualization shown here is a simple summary of the similarity of the datasets, but with appropriate interactive graphics one could easily focus on the specific regions of interest. Another way would be to evaluate the difference spectrum and quickly identify features that are more prevalent in the Ugi library compared to the GSK library (i.e., positive values in the plot shown here) and vice versa.
[…] previous post did a quick comparison of the GSK anti-malarial screening dataset with a virtual library of Ugi […]
Thanks for getting the ball rolling Rajarshi! Is it possible for you to pick the most active molecules from the dataset and provide a short list of Ugi products that are most similar?
Irrelevant question maybe but how did you plot the first (comparison) graph?
Peter, I generated the bit spectrum using the fingerprint package and then plotted the two spectra via the lattice xyplot method
I found it. Took me some time to get it right but works for me. Thank for yet another interesting tool.