Author Count Frequencies in PubMed

Earlier today, Emily Wixson posted a question on the CHMINF-L list asking

… if there is any way to count the number of authors of papers with specific keywords in the title by year over a decade …

Since I had some code compiling and databases loading I took a quick stab, using Python and the Entrez services. The query provided by Emily was

1
(RNA[Title] OR "ribonucleic acid"[Title]) AND ("2009"[Publication Date] : "2009"[Publication Date])

The Python code to retrieve all the relevant PubMed ID’s and then process the PubMed entries to extract the article ID, year and number of authors is below. For some reason this query also retrieves articles from before 2001 and articles with no year or zero authors, but we can easily filter those entries out.

1
2
3
4
5
6
7
8
9
10
11
12
13
14
15
16
17
18
19
20
21
22
23
24
25
26
27
28
29
import urllib, urllib2, sys
import xml.etree.ElementTree as ET

def chunker(seq, size):
    return (seq[pos:pos + size] for pos in xrange(0, len(seq), size))

query = '(RNA[Title] OR "ribonucleic acid"[Title]) AND ("2009"[Publication Date] : "2009"[Publication Date])'

esearch = 'http://eutils.ncbi.nlm.nih.gov/entrez/eutils/esearch.fcgi?db=pubmed&mindate=2001&maxdate=2010&retmode=xml&retmax=10000000&term=%s' % (query)
handle = urllib.urlopen(esearch)
data = handle.read()

root = ET.fromstring(data)
ids = [x.text for x in root.findall("IdList/Id")]
print 'Got %d articles' % (len(ids))

for group in chunker(ids, 100):
    efetch = "http://eutils.ncbi.nlm.nih.gov/entrez/eutils/efetch.fcgi?&db=pubmed&retmode=xml&id=%s" % (','.join(group))
    handle = urllib.urlopen(efetch)
    data = handle.read()

    root = ET.fromstring(data)
    for article in root.findall("PubmedArticle"):
        pmid = article.find("MedlineCitation/PMID").text
        year = article.find("MedlineCitation/Article/Journal/JournalIssue/PubDate/Year")
        if year is None: year = 'NA'
        else: year = year.text
        aulist = article.findall("MedlineCitation/Article/AuthorList/Author")
        print pmid, year, len(aulist)

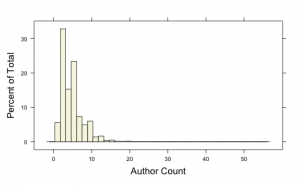
With ID’s, year and author counts in hand, a bit of R lets us visualize the distribution of author counts, over the whole decade and also by individual years.

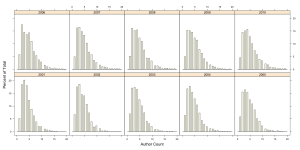
The median author count is 4, There are a number of papers that have more than 15 and some single papers with more than 35 authors on them. If we exclude papers with, say more than 20 authors and view the distribution by year we get the following set of histograms

We can see that over the years, while the median number of authors on a paper is more or less constant at 4 and increases to 5 in 2009 and 2010. But at the same time, the distribution does grow broader over the years, indicating that there is an increasing number of papers with larger author counts.

Anyway, this was a quick hack, and there are probably more rigorous ways to do this (such as using Web of Science – but automating that would be painful).
Pig and Cheminformatics

Pig is a platform for analyzing large datasets. At its core is a high level language (called Pig Latin), that is focused on specifying a series of data transformations. Scripts written in Pig Latin are executed by the Pig infrastructure either in local or map/reduce modes (the latter making use of Hadoop).

Previously I had investigated Hadoop for running cheminformatics tasks such as SMARTS matching and pharmacophore searching. While the implementation of such code is pretty straightforward, it’s still pretty heavyweight compared to say, performing SMARTS matching in a database via SQL. On the other hand, being able to perform these tasks in Pig Latin, lets us write much simpler code that can be integrated with other non-cheminformatics code in a flexible manner. An example of Pig Latin script that we might want to execute is:

1
2
3
A = load 'medium.smi' as (smiles:chararray);
B = filter A by net.rguha.dc.pig.SMATCH(smiles, 'NC(=O)C(=O)N');
store B into 'output.txt';

The script loads a file containing SMILES strings and then filters entries that match the specified SMARTS pattern and writes out the matching SMILES to an output file. Clearly, very similar to SQL. However, the above won’t work on a default Pig installation since SMATCH is not a builtin function. Instead we need to look at  a user defined function (UDF).

UDF’s are implemented in Java and can be classified into one of three types: eval, aggregate or filter functions. For this example I’ll consider a filter function that takes two strings representing a SMILES string and a SMARTS string and returns true if the SMILES contains the specified pattern.

1
2
3
4
5
6
7
8
9
10
11
12
13
14
15
16
17
18
19
20
21
22
23
public class SMATCH extends FilterFunc {
    static SMARTSQueryTool sqt;static {
        try {
            sqt = new SMARTSQueryTool("C");
        } catch (CDKException e) {
            System.out.println(e);
        }
    }
    static SmilesParser sp = new SmilesParser(DefaultChemObjectBuilder.getInstance());

    public Boolean exec(Tuple tuple) throws IOException {
        if (tuple == null || tuple.size() < 2) return false;
        String target = (String) tuple.get(0);
        String query = (String) tuple.get(1);
        try {
            sqt.setSmarts(query);
            IAtomContainer mol = sp.parseSmiles(target);
            return sqt.matches(mol);
        } catch (CDKException e) {
            throw WrappedIOException.wrap("Error in SMARTS pattern or SMILES string "+query, e);
        }
    }
}

A UDF for filtering must implement the FilterFunc interface which specifies a single method, exec. Within this method, we check whether we have the requisite number of input arguments and if so, simply return the value of the SMARTS match. For more details on filter functions see the UDF manual.

One of the key features of the code is the static initialization of the SMILES parser and SMARTS matcher. I’m not entirely sure how many times the UDF is instantiated during a query (once for each “row”? Once for the entire query?) – but if it’s more than once, we don’t want to instantiate the parser and matcher in the exec function. Note that since Hadoop is not a multithreaded model, we don’t need to worry about the lack of thread safety in the CDK.

Compiling the above class and packaging it into a jar file, allows us to run the above Pig Latin script (you’ll have to register the jar file at the beginning by writing register /path/to/myudf.jar) from the command line:

1
2
3
4
5
6
7
$ pig-0.4.0/bin/pig -x local match.pig # runs in local mode
$ 2010-09-09 20:37:00,107 [main] INFO  org.apache.pig.Main - Logging error messages to: /Users/rguha/src/java/hadoop-0.18.3/pig_1284079020107.log
$ 2010-09-09 20:37:39,278 [main] INFO  org.apache.pig.backend.local.executionengine.LocalPigLauncher - Successfully stored result in: "file:/Users/rguha/src/java/hadoop-0.18.3/output.txt"
$ 2010-09-09 20:37:39,278 [main] INFO  org.apache.pig.backend.local.executionengine.LocalPigLauncher - Records written : 9
$ 2010-09-09 20:37:39,278 [main] INFO  org.apache.pig.backend.local.executionengine.LocalPigLauncher - Bytes written : 0
$ 2010-09-09 20:37:39,278 [main] INFO  org.apache.pig.backend.local.executionengine.LocalPigLauncher - 100% complete!
$ 2010-09-09 20:37:39,278 [main] INFO  org.apache.pig.backend.local.executionengine.LocalPigLauncher - Success!!

As with my previous Hadoop code, the above UDF can be deployed anywhere that Hadoop and HDFS is installed – such as Amazon. The code in this post (and for other Pig UDFs) is available from my repository (in the v18 branch) and is based on Pig 0.4.0 – which is pretty old, but is required to work with Hadoop 0.18.3.

Back from Boston

Another ACS National Meeting, this time in Boston, is over and I’m finally home. I gave two talks, one on issues surrounding the data deluge in modern drug discovery and another one on structure activity landscapes. There were a number of great sessions in CINF, COMP and MEDI, with some thought-provoking talks. I especially liked a talk given by Birte Seebeck, in which they abstracted the idea of SALI (which focuses on structural features of ligands) to one that considers interactions betwen a ligand and a receptor – thus identifying activity hotspots within a protein site that actually cause the activity cliffs. The idea is somewhat similar to SiFT’s, but differs in that it takes into account the SAR. (As a side note, I discovered that one of our landscape papers is in the Top 25 in Drug Discov. Today). Gerry Maggiora gave a very thought provoking talk on the topic of activity cliffs,  highlighting the fact that there’s a lot of open questions that need to be looked at in this area. Ant Nicholls of spoke on the disconnect between molecular modeling in academia industry. His three suggestions: rigorous statistics training, stop government funding for all but basic research and all remaining funding must have an experimental component.

I also met up with a number of old friends, met some people with whom I’d only had email or FriendFeed conversations and made new friends. We had a Blue Obelisk dinner, with Christoph awarding a Blue Obelisk to Nina Jeliazkova. This time round, we got a whole restaraunt to ourselves, thanks to Christoph, so conversations was much easier! Also the financial contribution towards the dinner from Bob Belford and Harry Pence was very much appreciated.

At this meeting I finally got round to making use of Twitter – it turns out it was quite useful for keeping running notes during a talk, as well as keeping track of other parallel sessions. Thanks to Egon for those extra tweets (though maybe Egon and I were being a bit obssesive!?). A quick hack I put together just before the meeting allowed Tweeters to visualize the Twitter stream emanating from the ACS meeting as a word cloud. Obviously, it works better with more people tweeting, but cute nonetheless.

As always, CINF hosts some great receptions and this meetings’ ones were no exception. Though the weather didn’t cooperate, the convention center was pretty nice in providing free wireless. This came in especially useful as we had a speaker with three talks in our program but was unable to make it to the meeting. With the wireless available, we successfully connected with him over Skype, and with me switching slides, were able to have him present (audio and video) his work. Definitely not a trend we want to encourage, but for emergencies, “Skype talks” are great!

At this meeting I also organized an experimental symposium consisting of lightning talks – 8 minutes talks on arbitrary (but hopefully interesting) topics in chemical information and cheminformatics. While we only had 5 speakers, we had a great set of talks – I’m still amazed at how Richard West got through 24 slides in 7 minutes so smoothly! While it could have been publicized better, we got a lot of good feedback and will be running a revamped version in Denver, next fall.

Overall a pretty good meeting, and my last meeting as CINF Program Chair. I had a great time in this role, and with the help of a very capable Program Committee, I think we were able to successfully develop interesting multidisciplinary programs over the last four meetings. As I step down, Rachelle Bienstock from the NIEHS will take over as Program Chair, and I wish her all the best. However, I’m not done with CINF just yet :) I’ve been elected as Chair-Elect of CINF for 2011 so will be switching roles (though I certainly hope to continue contributing to the CINF program in the future).
I’ll end with three suggestions for the ACS: 1. Seriously consider letting divisions to drop Thursdays 2. Reduce registration fees & do a better job on hotel rates 3. Fix the meetings to one or two places (preferably San Francisco).

Update: I had misstated Anthony Nicholl points from his presentation. The post is updated to the correct that.

SALI in Bulk

Sometime back John Van Drie and I had developed the Structure Activity Landscape Index (SALI), which is a way to quantify activity cliffs – pairs of compounds which are structurally very similar but have significantly different activities. In preparation for a talk on SALI at the Boston ACS, I was looking for SAR datasets that contained cliffs. It turns out that ChEMBL is a a great resource for SAR data. And with the EBI providing database dumps it’s very easy to query across the entire collection to find datasets of interest.

For the purposes of this talk, I wanted to see what the datasets looked like in terms of the presence (or absence of cliffs). Given that the idea of an activity cliff is only sensible for ligand receptor type interactions, I only considered compound sets associated with binding assays. Furthermore, I only considered those assays which involved human targets, had a confidence score greater than 8 and contained between 75 and 500 molecules. (If you have an Oracle installation of ChEMBL then this SQL snippet will get you the list of assays satisfying these constraints).

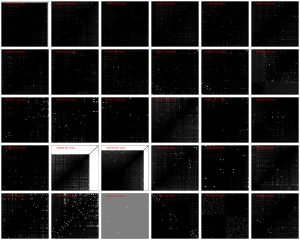
This gives us 31 assays, which we can now analyze. For the purposes of this note, I evaluated the CDK hashed fingerprints and used the standardized activities to generate the pairwise SALI values for each of the datasets (performing the appropriate log transformation  of the activities when required). The matrices that represent the pairwise SALI values are plotted in the heatmap montage below (the ChEMBL assay ID is noted in each image) where black represents the minimum SALI value and white represents the maximum SALI value for that dataset. (See the original paper for more details on this representation.) Clearly, the “roughness” of the activity landscape differs from dataset to dataset.

At this point I haven’t looked in depth into each dataset to characterize the landscapes in more detail, but this is a quick summary of multiple datasets. (Though a few datasets contain cliffs which are derived from stereoiomers and hence may not actually be real cliffs – since their activity difference may be small, but will look structurally identical to the fingerprint).

An alternative and useful representation is to convert the SALI values for a dataset into an empirical cumulative distribution function to provide a more quantitative view of how cliffs are distributed within a landscape. I’ll leave those details for the talk.

Job Openings at the NCGC

I’ve been at the NCGC for a little more than a year and I can say that it’s a great place to work – smart people, cutting edge projects in chemical genomics and chemical biology, opportunities to be involved in all aspects of HTS projects and fresh data (lots of it). Now there’s opportunities for others to join the fun!

Sometime back, my colleague Trung posted an ad for a software engineer position, primarily working on our chemogenomics data application. Now, we’re also looking for a research informatics scientist. See the detailed ad for more information. For both positions, see the ads themselves for contact details. If you’d like to chat face to face I’ll be at the ACS in Boston this month, so drop me a line and we can chat in Boston.