Sometime back John Van Drie and I had developed the Structure Activity Landscape Index (SALI), which is a way to quantify activity cliffs – pairs of compounds which are structurally very similar but have significantly different activities. In preparation for a talk on SALI at the Boston ACS, I was looking for SAR datasets that contained cliffs. It turns out that ChEMBL is a a great resource for SAR data. And with the EBI providing database dumps it’s very easy to query across the entire collection to find datasets of interest.
For the purposes of this talk, I wanted to see what the datasets looked like in terms of the presence (or absence of cliffs). Given that the idea of an activity cliff is only sensible for ligand receptor type interactions, I only considered compound sets associated with binding assays. Furthermore, I only considered those assays which involved human targets, had a confidence score greater than 8 and contained between 75 and 500 molecules. (If you have an Oracle installation of ChEMBL then this SQL snippet will get you the list of assays satisfying these constraints).
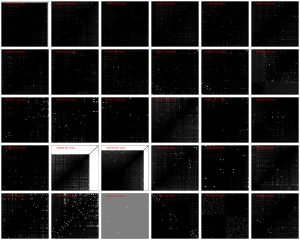
This gives us 31 assays, which we can now analyze. For the purposes of this note, I evaluated the CDK hashed fingerprints and used the standardized activities to generate the pairwise SALI values for each of the datasets (performing the appropriate log transformation of the activities when required). The matrices that represent the pairwise SALI values are plotted in the heatmap montage below (the ChEMBL assay ID is noted in each image) where black represents the minimum SALI value and white represents the maximum SALI value for that dataset. (See the original paper for more details on this representation.) Clearly, the “roughness” of the activity landscape differs from dataset to dataset.
At this point I haven’t looked in depth into each dataset to characterize the landscapes in more detail, but this is a quick summary of multiple datasets. (Though a few datasets contain cliffs which are derived from stereoiomers and hence may not actually be real cliffs – since their activity difference may be small, but will look structurally identical to the fingerprint).
An alternative and useful representation is to convert the SALI values for a dataset into an empirical cumulative distribution function to provide a more quantitative view of how cliffs are distributed within a landscape. I’ll leave those details for the talk.
