Byproducts of Byproducts & Biomedical Data

Recently I came across a fantastic article that explored how far ahead Google Maps is compared to Apple Maps, focusing in particular on Areas of Interest (AOI), and how this is achieved with Googles competencies in massive data and massive computation, resulting in a moat. The conclusion is that

Google has gathered so much data, in so many areas, that it’s now crunching it together and creating features that Apple can’t make—surrounding Google Maps with a moat of time

But the key point that caught my eye was the idea that Google Maps sophistication is a byproduct of byproducts. As pointed out, AOI’s are a byproduct of buildings (a byproduct of satellite imagery) and places (a byproduct of Street View) and thus AOI’s are byproducts of byproducts.

This observation led me to thinking of how it could apply in a biomedical setting. In other words, given disparate biomedical data types, what new data types can be generated from them, and using those derived data types what further data types could be derived again? (“data type” may not be the right term to use here, and “entity” may be a more suitable one).

One interpretation of this idea are integrative resources, where disparate (but related) data types are connected to each other in a single store, allowing one to (hopefully) make non-obvious links between entities that explain a higher level system or phenomenon. Recent examples include Pharos and MARRVEL. However, these don’t really fit the concept of byproducts of byproducts as neither of these resources actually generate new data from pre-existing data, at least by themselves.

So are there better examples? One that comes to mind is the protein folding problem. While one could fold proteins de novo, it’s a little easier if constraints are provided. Thus we have constraints derived from NMR and AA coevolution. As a result we can view predicted protein structures as a byproduct of NMR constraints (a byproduct of structure determination) and a byproduct of AA co-evolution data (a byproduct of gene sequencing). An example of this is Tang et al, 2015.

Another one that comes to mind are inferred gene (or signalling, metabolic etc) networks, which go from say, gene expression data to a network of genes. But going by the Google Maps analogy above, the gene network is the first level byproduct. One could image a computation that processes a set of (inferred) gene networks to generate higher level structures (say, spatial localization or differentiation). But this is a bit more fuzzier than the protein structure problem

Of course, this starts to break down when we take into account errors in the individual components. Thus sequencing errors can introduce errors in the coevolution data, which can get carried over into the protein structure. This isn’t inevitable – but it does require validation and possibly curation. And in many case, large, correlated datasets can allow one to account for errors (or work around them).

This is mainly speculation on my part, but it seems interesting to try and think of how one can combine disparate data types to generate new ones, and repeat this process to come up with something new that was not available (or not obvious) from the initial data types.
Waterfall Plots for Dose Response Curves

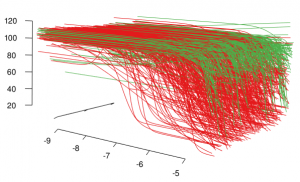
Waterfall plots are a common visualization method to view multiple spectra and have some similarities with joy plots. In the high throughput screening world, people have plot multiple dose response curves, offset on the z-axis to produce something that looks like a waterfall. An example is Figure 1 in Inglese et al, PNAS, 2006, 103(31). In my opinion, such visualizations are not much more than eye candy and not particulary informative, though it helps if the curves to be displayed are picked carefully so that they can be differentiated in the plot. However, people seem to like them and I’ve been asked to generate them based on dose response fit parameters.

Here’s an implementation using rgl, which results in an interactive waterfall plot. An example of the output is shown below

A waterfall plot for active (red) and inconclusive (green) dose response curves

A waterfall plot for active (red) and inconclusive (green) dose response curves

1
2
3
4
5
6
7
8
9
10
11
12
13
14
15
16
17
18
19
20
21
22
23
24
25
26
27
28
29
30
31
32
33
34
35
36
37
38
library(rgl)
library(RColorBrewer)

## Get view parameters we set previously
load('http://blog.rguha.net/wp-content/uploads/2017/09/waterfall-view.rda')

## Set up colors for curve types
pal <- as.list(brewer.pal(3, "Set1"))
names(pal) <- c('active', 'inactive', 'inconc')

cdata <- read.csv('http://blog.rguha.net/wp-content/uploads/2017/09/curves.csv',
                  header=TRUE)

interleave <- function(x) {
    unlist(lapply(1:(length(x)-1), function(i) c(x[i], x[i+1])))
}

f <- function(params, concs, interleave=TRUE) {
  xx <- seq(min(concs)*1.1, max(concs)*1.1, length=100)
  yy <- with(params, ZERO + (INF-ZERO)/(1 + 10^( (LAC50-xx)*HILL) ))
  if (interleave) {
      xx <- interleave(xx)
      yy <- interleave(yy)
  }
  return(data.frame(x=xx, y=yy))
}

open3d(scale=c(150, 3.5, 1),
       userMatrix = userMatrix, windowRect=windowRect)
for (i in 1:nrow(cdata)) {
    d1 <- data.frame(f(cdata[i,], c(-9, -4)),z=i)
    segments3d(x=d1[,1], y=d1[,2], z=d1[,3],
               col=pal[[cdata$klass[i]]])
}
axis3d('x-+', ntick=5)
axis3d('y-+', ntick=5)
axis3d('z--', labels=FALSE, tick=TRUE)
title3d(xlab="log Concentration",ylab="Response",zlab="")

CSA Trust Grant – Call for Proposals

Applications Invited for CSA Trust Grant for 2017

The Chemical Structure Association (CSA) Trust is an internationally recognized organization established to promote the critical importance of chemical information to advances in chemical research.  In support of its charter, the Trust has created a unique Grant Program and is now inviting the submission of grant applications for 2017.

Purpose of the Grants

The Grant Program has been created to provide funding for the career development of young researchers who have demonstrated excellence in their education, research or development activities that are related to the systems and methods used to store, process and retrieve information about chemical structures, reactions and compounds.  One or more Grants will be awarded annually up to a total combined maximum of ten thousand U.S. dollars ($10,000).  Grantees have the option of payments being made in U.S. dollars or in British Pounds equivalent to the U.S. dollar amount. Grants are awarded for specific purposes, and within one year each grantee is required to submit a brief written report detailing how the grant funds were allocated. Grantees are also requested to recognize the support of the Trust in any paper or presentation that is given as a result of that support.

Who is Eligible?

Applicant(s), age 35 or younger, who have demonstrated excellence in their chemical information related research and who are developing careers that have the potential to have a positive impact on the utility of chemical information relevant to chemical structures, reactions and compounds, are invited to submit applications.  While the primary focus of the Grant Program is the career development of young researchers, additional bursaries may be made available at the discretion of the Trust.  All requests must follow the application procedures noted below and will be weighed against the same criteria.

Which Activities are Eligible?

Grants may be awarded to acquire the experience and education necessary to support research activities; e.g. for travel to collaborate with research groups, to attend a conference relevant to one’s area of research (including the presentation of an already-accepted research paper), to gain access to special computational facilities, or to acquire unique research techniques in support of one’s research. Grants will not be given for activities completed prior to the grant award date.

Application Requirements

Applications must include the following documentation:

  1. A letter that details the work upon which the Grant application is to be evaluated as well as details on research recently completed by the applicant;
  2. The amount of Grant funds being requested and the details regarding the purpose for which the Grant will be used (e.g. cost of equipment, travel expenses if the request is for financial support of meeting attendance, etc.). The relevance of the above-stated purpose to the Trust’s objectives and the clarity of this statement are essential in the evaluation of the application);
  3. A brief biographical sketch, including a statement of academic qualifications and a recent photograph;
  4. Two reference letters in support of the application.  Additional materials may be supplied at the discretion of the applicant only if relevant to the application and if such materials provide information not already included in items 1-4.   A copy of the completed application document must be supplied for distribution to the Grants Committee and can be submitted via regular mail or e-mail to the Committee Chair (see contact information below).

Deadline for Applications

Application deadline for the 2017 Grant is March 31, 2017. Successful applicants will be notified no later than May 9, 2017.

Address for Submission of Applications: 

The application documentation can be mailed via post or emailed to:  Bonnie Lawlor, CSA Trust Grant Committee Chair, 276 Upper Gulph Road, Radnor, PA 19087, USA.  If you wish to enter your application by e-mail, please contact Bonnie Lawlor at chescot@aol.com prior to submission so that she can contact you if the e-mail does not arrive.

Endnote XML to HTML or LaTeX

Over the last few years I’ve been maintaining my publication list as a BibTeX file, managed by BibDesk. This is handy when writing papers, but it’s also useful to use this data to keep my CV updated or generate a publications page. Since BibDesk can export to Endnote XML format, I put together a simple Python script to process that to HTML or LaTeX. The latter assumes that you’re going to include the generated LaTeX file in a document that employs the CuRve package. The output is designed according to my preferences, but it’s easily modifiable.

The code is available at https://github.com/rajarshi/genpubs

Freedom from the IF: Impact Neutral Publishing

I came across a post from Jan Jensen a few months ago about a GRC meeting that he had attended. What caught my eye however, was his comment on “impact neutral” publishing. Specifically, he mentions

For me “impact neutrality” has become just as important as OA. It is so very liberating to just write down what I did and what I found rather than trying to put everything in the best possible light with elaborately constructed “technically-correct-but-not-really-telling-the-whole-story” paragraphs.

As a methods person myself, this resonated with me, and while not always feasible, I hope to be able to make some progress towards this form of publishing in the coming year.

So what does this mean? Essentially, you publish your work in the journal with the best fit, irrespective of impact factor (IF) or other measures of journal importance. By bypassing importance metrics it allows one to consider other, more relevant parameters such as topical fit and accessibility. Why is this approach useful? First, IF measures impact of a journal, and as a result, all work in a high IF venue is not necessarily impactful and conversely, work in low IF venue is not necessarily non-impactful. Second, an impact neutral publication can be a more honest description of what was done, since there’s less need to put a spin to justify impact. Third, it can avoid time spent in the journal funnel.

Importantly, impact neutral publication doesn’t imply poorly written or run-of-the-mill papers. A story still needs to be told in a clear and succinct fashion. In the end, publication is about letting people know what you did. As opposed to impressing people by what you did.

So, there are definitely benefits to this view of publishing. Is it for everybody? Ideally yes, but in todays climate, it doesn’t always work out. Indeed, this thread highlights the issues with asking people to ignore IF. It works well if judgement is not important/irrelevant (tenured faculty). In addition, there are groups such as government labs, for whom IMO impact should not be a factor, that could follow this publication policy. Of course, it is also true that much work is done by groups and within such a setting, different members will have different needs and agendas. So arbitrarily forcing impact neutral publication is not always feasible.

What are the downsides to this approach to publishing? For early career researchers and people hunting for money (aka grants), it is obvious – hiring and funding committees, unfortunately, do look at impact factors in many cases. While some people are pushing for changes, we’re not there yet. Having said that, what is the effect on the work itself that is published in this form? The primary effect is that it goes unnoticed or ignored or considered poor quality due to venue. In addition, such work may not benefit from popular press. Both these outcomes are unfair, but given the information overload of todays world, not unexpected.

So how does one address these drawbacks? There are two levels to this – at the individual level, the use of Twitter, blogs and other social media can help spread the word of your work. As you might expect this approach publicizes the work within your topical community. To break out of this sphere requires “network effects” and is non-trivial to achieve. However, the scientific community should also address this by way of cultural changes. Given that different fields have different cultures and policies, it’s unreasonable to expect every scientist to accept or even attempt these changes. But when certain fields are open to change and have people championing this (and other) approaches to publications, I believe that the community (which in reality are the senior scientists sitting on committees and holding the reigns) should keep an open mind and seriously consider the benefits to impact neutral publications.