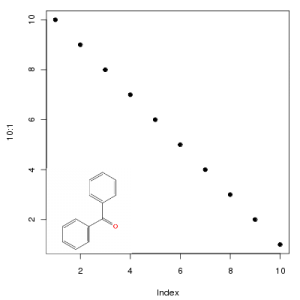
Recent versions of rcdk allow you to insert images of chemical structures into R plots, via the view.image.2d and rasterImage functions. One problem with the latter function is that the 2D structure image must be located in plot units, rather than pixel units. Paul Murrell suggested an easy way to insert the raster image into the plot region, maintaining the native resolution of the image:
1 2 3 4 5 6 7 8 9 10 11 12 13 14 | library(rcdk) m <- parse.smiles("O=C(C1=CC=CC=C1)C1=CC=CC=C1")[[1]] img <- view.image.2d(m, 200,200) plot(10:1, pch=19) ## Position the depiction at the lower left corner dpi <- (par("cra")/par("cin"))[1] usr <- par("usr") xl <- usr[1] yb <- usr[3] xr <- xl + xinch(200/dpi) yt <- yb + yinch(200/dpi) rasterImage(img, xl,yb, xr,yt) |
