I’ve been working for some time with the PubChem Bioassay collection – a set of 1293 assays that cover a range of techniques (enzymatic, phenotypic etc.), targets and sizes (from 20 molecules to 200,000 molecules). In addition, some assays are primary, high-throughput assays whereas a number of them are smaller, confirmatory assays. While an extremely valuable collection, one of the drawbacks is the lack of curation. This has led to some people saying that the data is too noisy to be useful. Yes, the noise is a problem, but I think there’s still useful data to extract and model.
One of the problems that I have faced is that while one can perform a full text search for assays on PubChem, there is no form of annotations on the assays themselves. One effect of this is that it is difficult to link an assay to other biological resources (though for enzymatic assays, one can determine a Pubmed protein identifier). While working on my bioassay network project, I needed annotations and I didn’t want to do it manually.
Automated GO Annotations
While manual annotations would be the most rigorous, I wanted to see to what extent automated methods could provide useful information. A bit of searching led me to GOCat run by Patrick Ruch, which analyzes text and predicts a set of GO terms that could be associated with that text. Working with Patrick and his student Julien Gobeill, we were able to process the description field of each assay to generate a set of “predicted GO terms”. The tool identifies each term as being related to function, component or pathway. and also provides a score for each predicted term, allowing us to rank the terms associated with an assay.
Verification
The first thing to consider was correctness – are the assigned GO terms sensible? I manually verified about 30 assays and for many of them the top five terms that GOCat assigned were quite relevant (i.e., specific terms, that would be close to or actual leaf nodes in the GO hierarchy). In general, if one considered the top 15 or 20 terms, the relevancy was quite high. However, there were a number of assays for which the assigned terms were very general and thus, not very informative. It turns out that most of these arose from assays in which the description field was very general or very short, though there were some examples where there was a long description but the resultant predicted terms were still quite general and non-speciific. Of course, this process of verification is subjective, and one can be more or less strict as to whether predicted terms make sense for a given assay.
Overall, the results aren’t too bad, but this was a quick check that was included in an abstract submission. More extensive verification (rigorous quality score, multiple people) are in the pipeline as we write up the paper.
Browsing
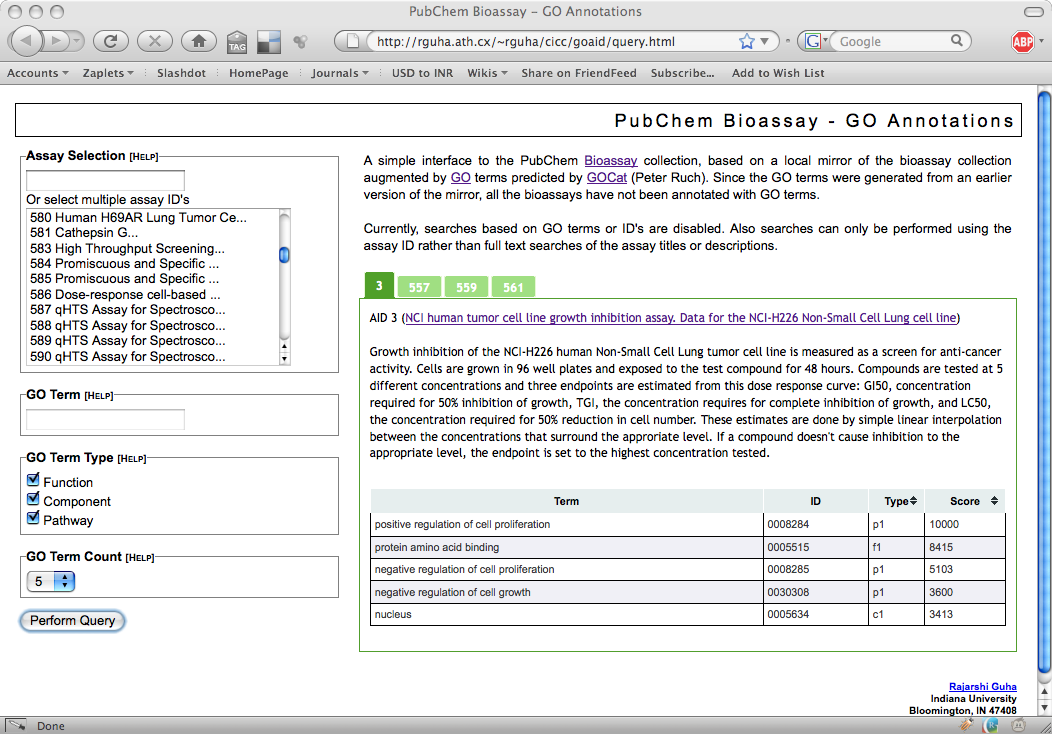
But as we proceed with verification, we are now able to link the bioassays with other biological resources via GO terms. After Patrick and Julien generated the predicted terms I put them into a Postgres database and whipped up a simple interface. It’s not complete but does let you view the terms associated with an assay to varying levels of detail (such as all terms, component-related terms etc).
Networks & Visualization
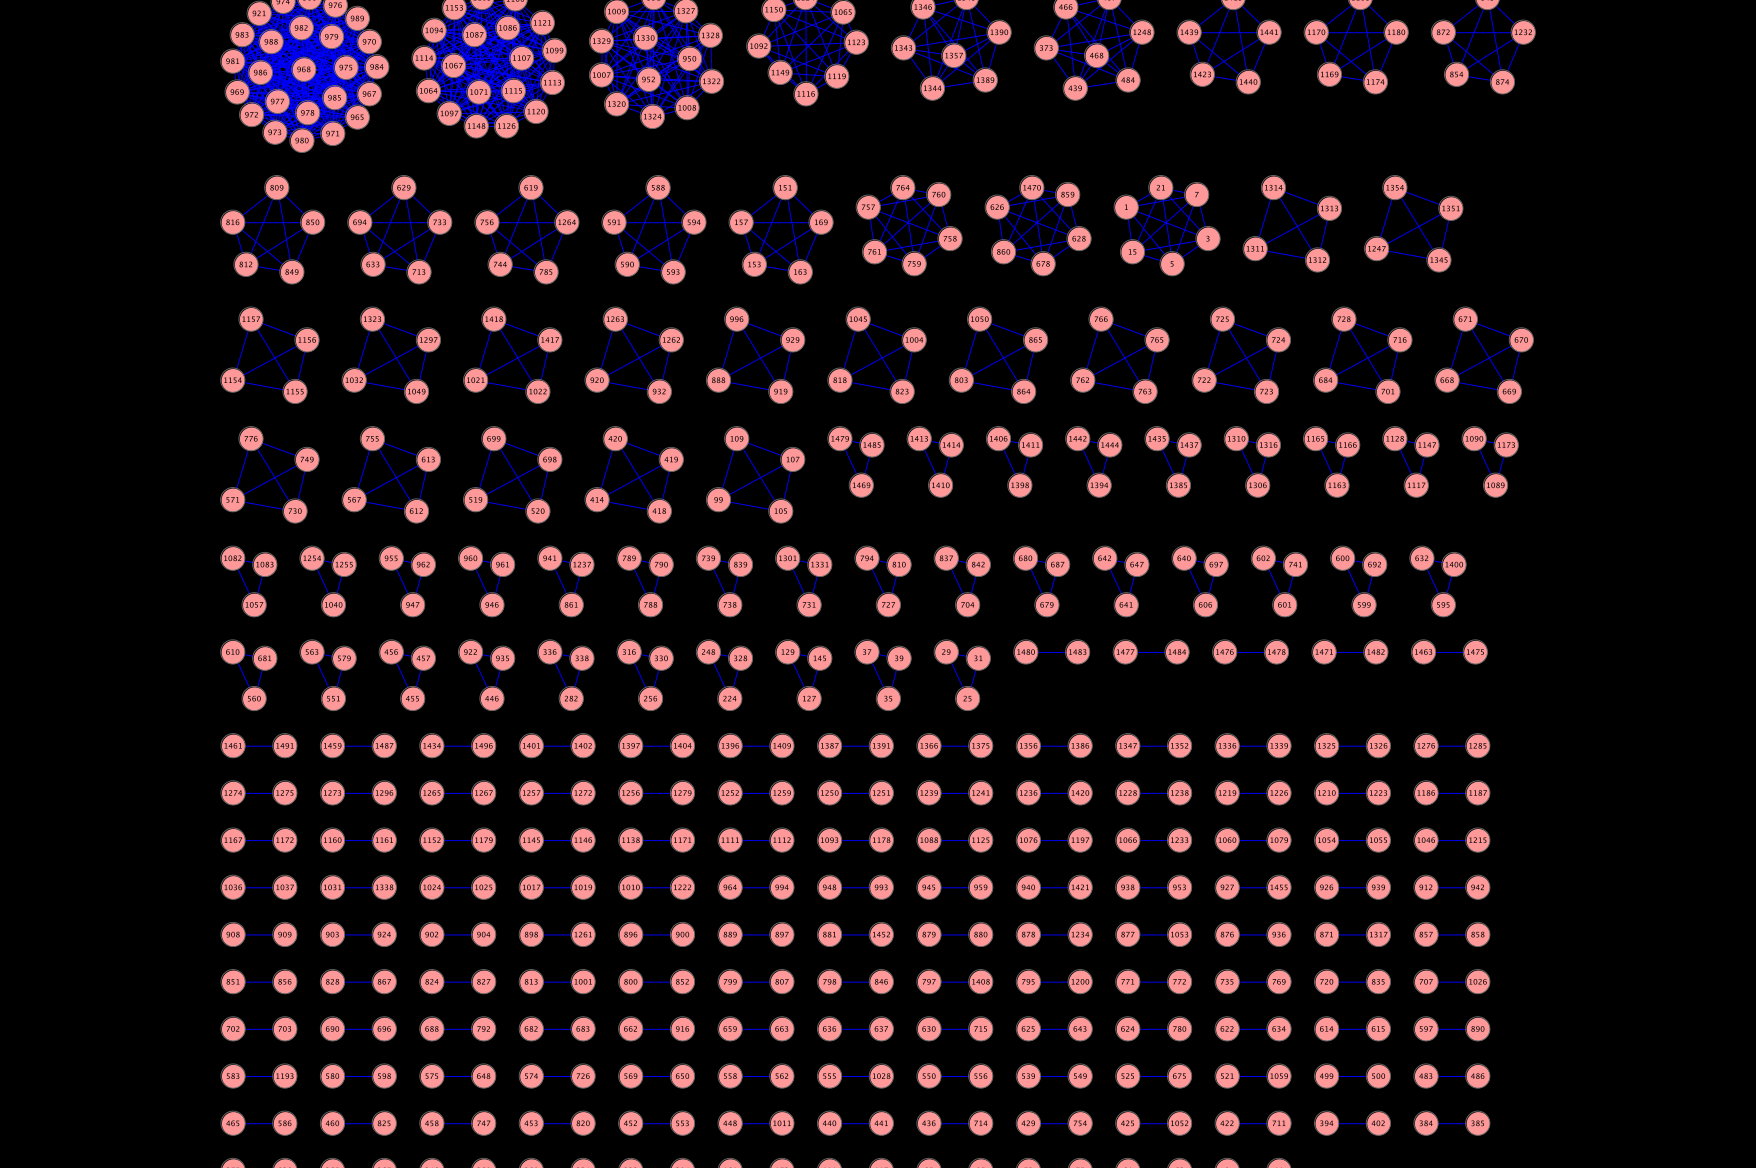
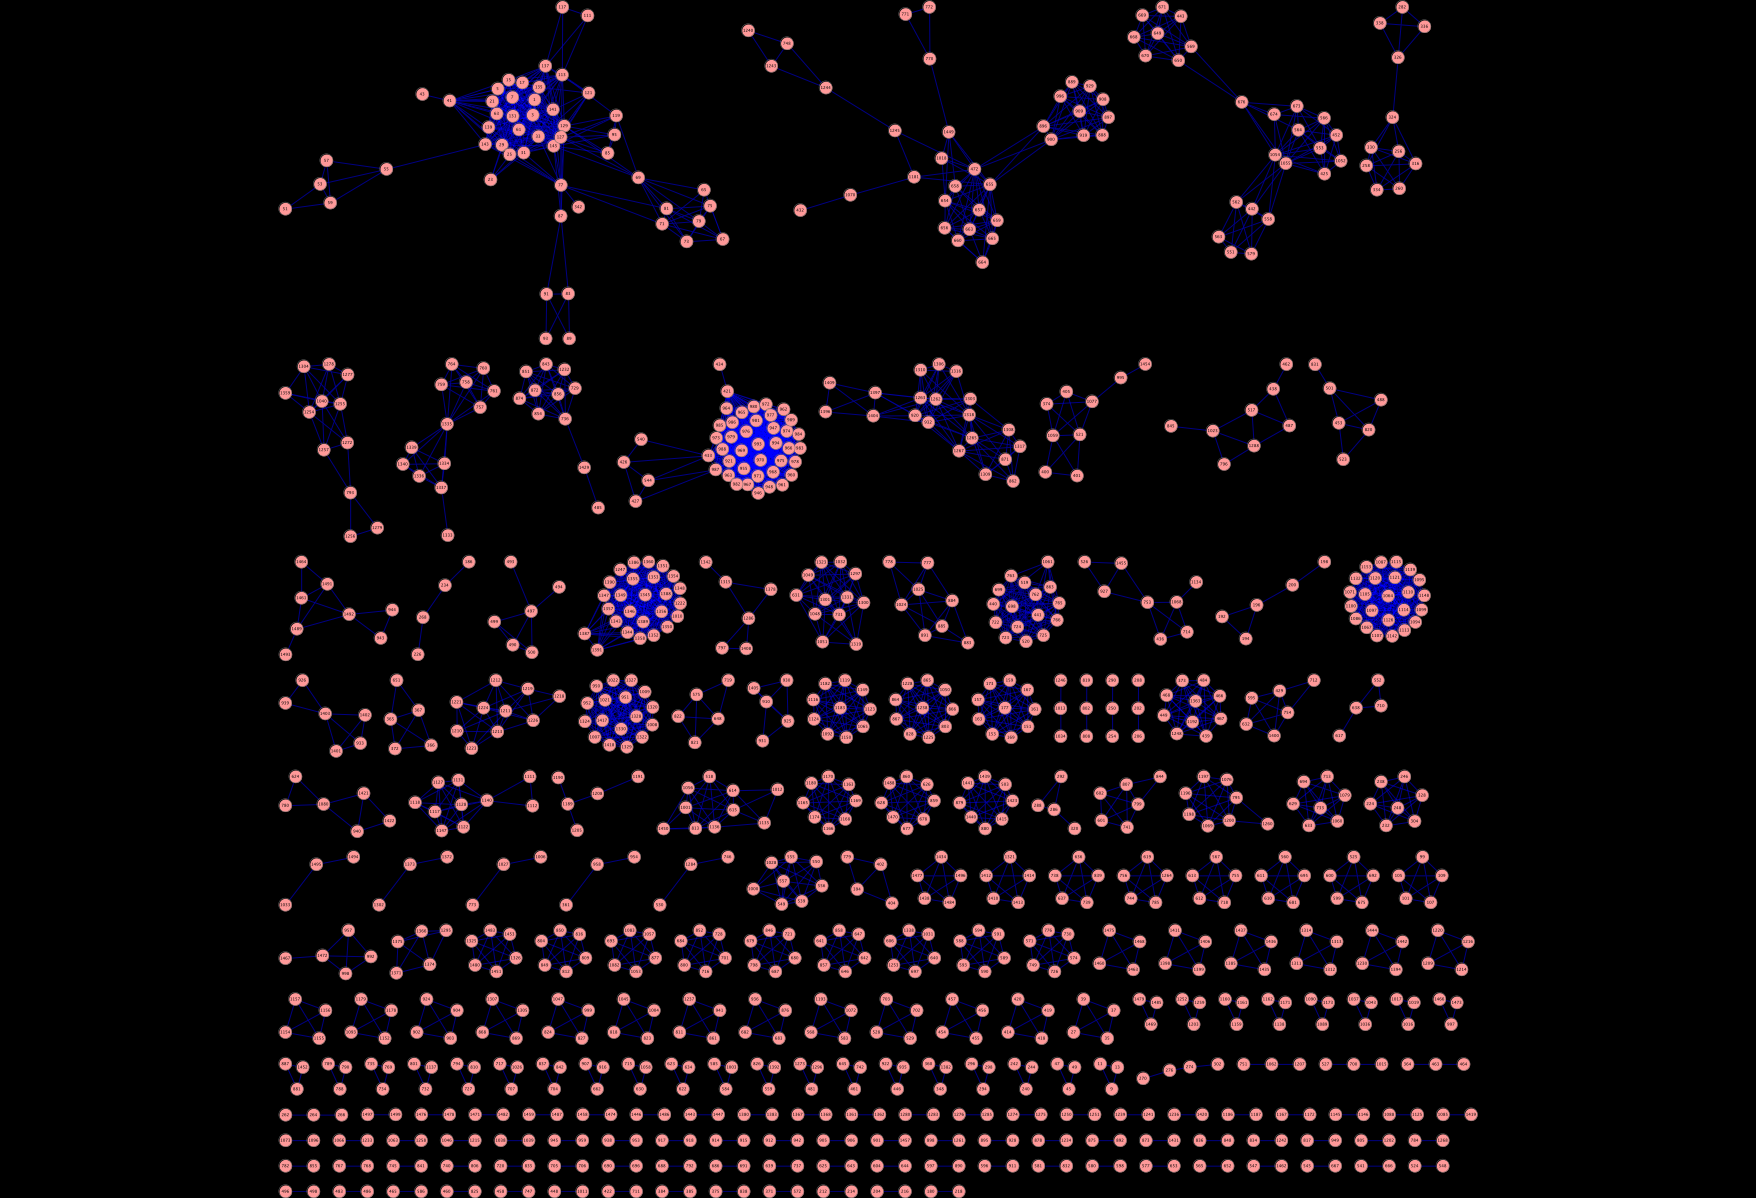
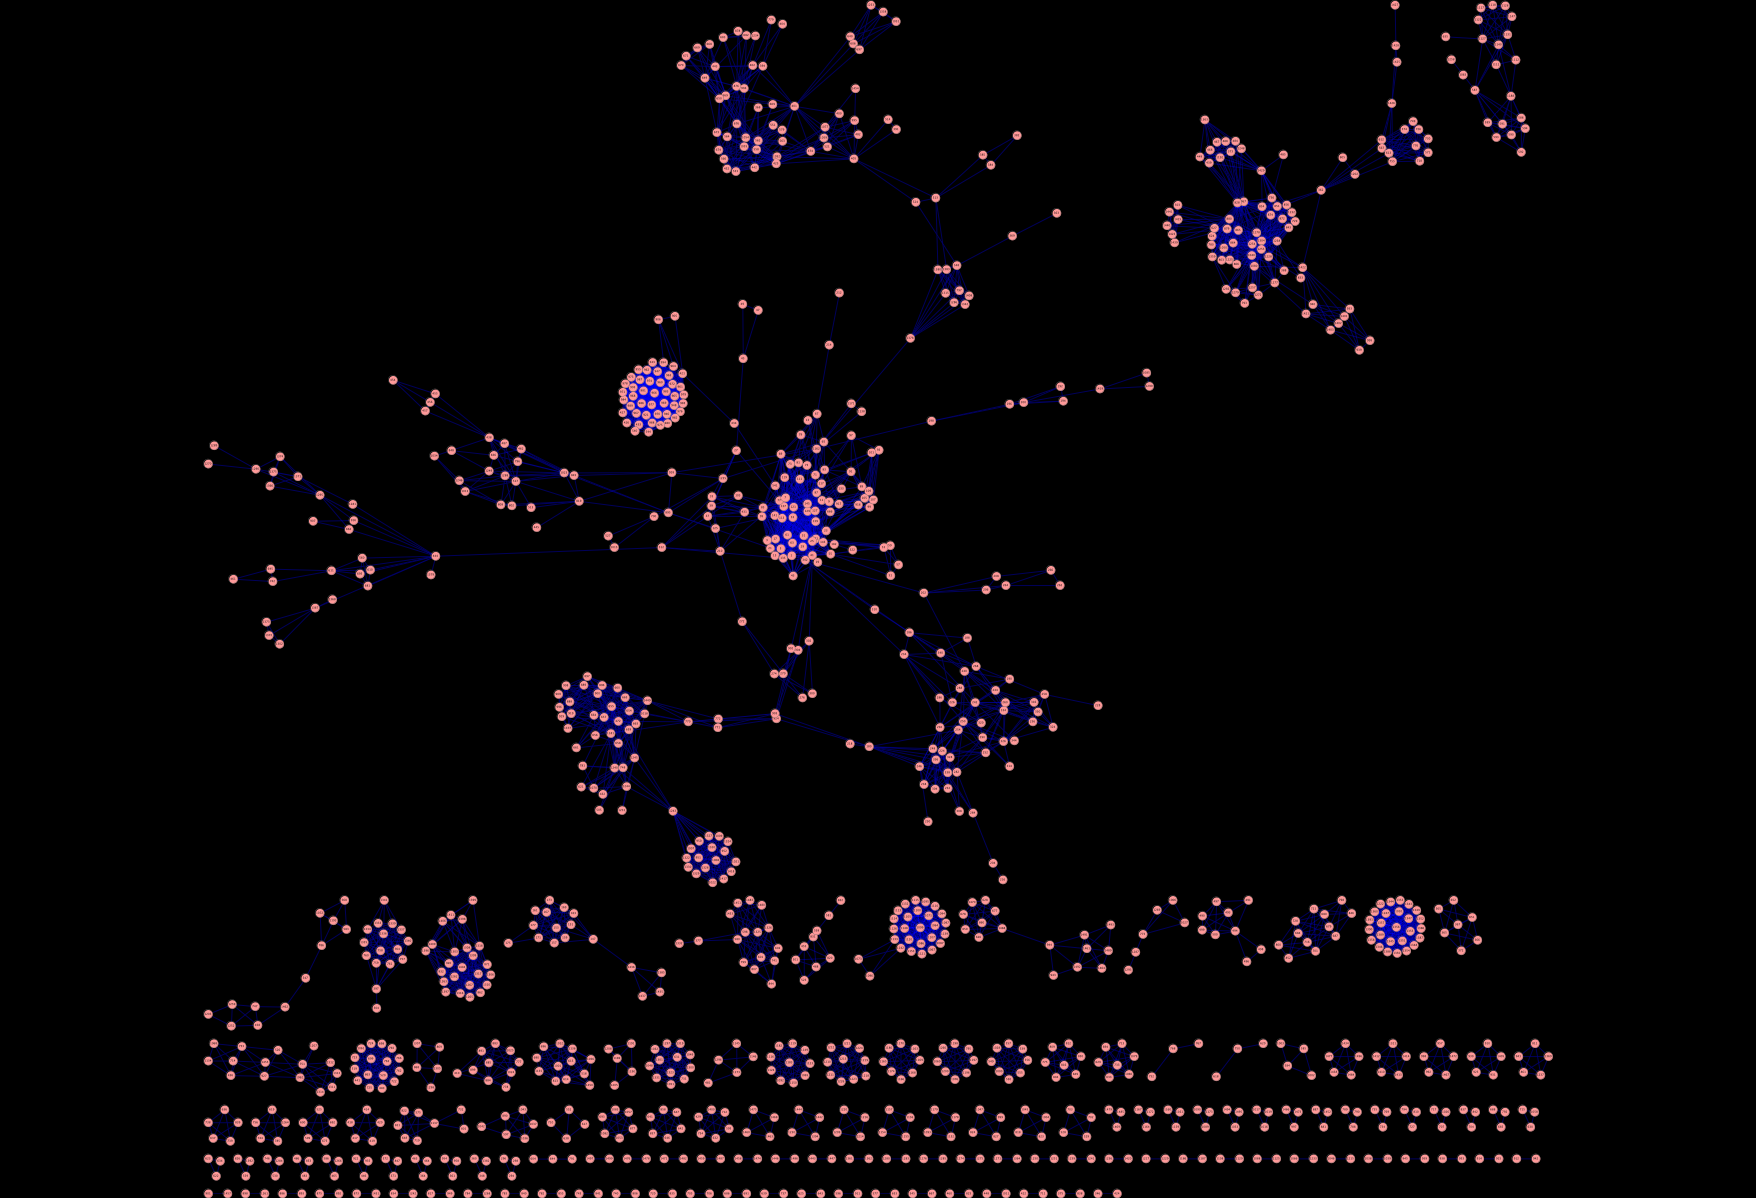
But the whole point of this exercise was to help me in my bioassay network project. More specifically I wanted to create a semantic similarity network of assays. That is, a network where the nodes are assays and two nodes are connected if the “semantic similarity” between two assays is greater than some cutoff. With the assigned GO terms, we can define a simplistic semantic similarity score by counting the number of terms in common between the top 10 terms for two assays. With normalization this gives us a value between 0 and 1. Now, such a similarity score is quite arbitrary but provides some nice advantages as I noted in my presentation. For now it leads to some nice pictures, that I think also provide some (high level) insight into the quality of the assigned terms. For example, using a cutoff of 0.9, we get a network that looks like Figure 1, where there are many disconnected components. Essentially, this is putting closely related assays together. This the large number of 2-node components appears to correspond to primary and secondary assay pairs. Wheres the larger clusters near the top tend to focus on groups of assays that have come from a specific center (such as the NCI DTP assays) or for a specific task (such as cytotoxicity assays). On going to lower cutoffs (Figures 2 and 3) we start seeing some interesting structures. As I noted, these are still just pretty pictures and I haven’t analysed them yet for meaning. But they do suggest these visualizations as a useful approach to exploring the assay collection compared with traditional full text search.
Great collaborators, fresh data, pretty pictures, intriguing analyses – aah life is good!


Hmmm…makes me think of space invaders for some reason.
[…] back I had described some work on the automated annotation of PubChem bioassays. The lack of annotations on the assays can make it […]