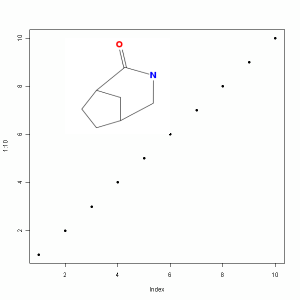
In preparation for the upcoming  R workshop at the EBI, I’ve been cleaning up the rcdk package and updating some features. One of the new features is the ability to get a 2D depiction as a raster image. Uptil now, 2D depictions were drawn in a Swing window – this allowed you to resize the window but not much else. You really couldn’t use it for anything else but viewing.
However, R-2.11.0 provides a new function called rasterImage, which overlays a raster image onto a pre-existing plot. It turns out that the png package lets me easily create such a raster image, either from a PNG file or from a vector of bytes. Given a molecules, we can get the byte array of its PNG representation via the view.image.2d function in the latest rcdk. As a result, you can now make a plot and then overlay a 2D depiction within the plot area. For example to get the picture shown alongside, we could do:
1 2 3 4 5 | library(rcdk) m <- parse.smiles("C1CC2CC1C(=O)NC2") img <- view.image.2d(m, 200,200) plot(1:10, pch=19) rasterImage(img, 2,6, 6,10) |
The latest version of rcdk and rpubchem is not on CRAN yet, but you can get source packages for OS X & Linux and binary packages for Windows at http://rguha.net/rcdk. Note that the latest version of rcdk requires R-2.11.0 along with rJava, rcdklibs, fingerprint and png as dependencies. If you’re interested in contributing check out the git repository.
Rajarshi, this is very cool!
Would it be difficult to draw a line from the molecule to one of the dots? To identify molecular outliers in QSAR models?
Actually that should be pretty easy – just work out the center of the figure (in the plotting coordinate space) and use lines(…) to join that and the point of intereest
[…] versions of rcdk allow you to insert images of chemical structures into R plots, via the view.image.2d and rasterImage functions. One problem […]