When running a high-throughput screen, one usually deals with hundreds or even thousands of plates. Due to the vagaries of experiments, some plates will not be ervy good. That is, the data will be of poor quality due to a variety of reasons. Usually we can evaluate various statistical quality metrics to asses which plates are good and which ones need to be redone. A common metric is the Z-factor which uses the positive and negative control wells. The problem is, that if one or two wells have a problem (say, no signal in the negative control) then the Z-factor will be very poor. Yet, the plate could be used if we just mask those bad wells.
Now, for our current screens (100 plates) manual inspection is boring but doable. As we move to genome-wide screens we need a better way to identify truly bad plates from plates that could be used. One approach is to move to other metrics – SSMD (defined here and applications to quality control discussed here) is regarded as more effective than Z-factor – and in fact it’s advisable to look at multiple metrics rather than depend on any single one.
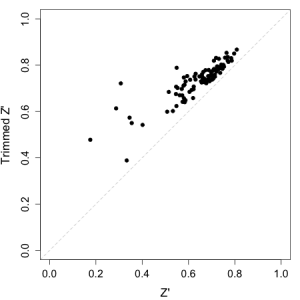
An alternative trick is to compare the Z-factor for a given plate to the trimmed Z-factor, which is evaluated using the trimmed mean and standard deviations. In our set up we trim 10% of the positive and negative control wells. For a plate that appears to be poor, due to one or two bad control wells, the trimmed Z-factor should be significantly higher than the original Z-factor. But for a plate in which, say the negative control wells all show poor signal, there should not be much of a difference between the two values. The analysis can be rapidly performed using a plot of the two values, as shown below. Given such a plot, we’d probably consider plates whose trimmed Z-factor are less than 0.5 and close to the diagonal. (Though for RNAi screens, Z’ = 0.5 might be too stringent).
From the figure below, just looking at Z-factor would have suggested 4 or 5 plates to redo. But when compared to the trimmed Z-factor, this comes down to a single plate. Of course, we’d look at other statistics as well, but it is a quick way to rapidly identify plates with truly poor Z-factors.
