Joe Leonard posted a question on the CCL mailing list today regarding “conformation envelopes”. More specifically, he asked
Has there been work on creating visualizations of “conformer envelopes”, graphical representations of the conformational space occupied (or available) to molecules. Particularly when such visualizations are used to (quickly/visually) compare whether 2 molecules can adopt the same shape – or if there are shapes of one that can’t be adopted by another.
A while back when I was investigating the use of the Ballester & Graham-Richards shape descriptors for 3D similarity searching. It turns out they perform quite poorly in enrichment benchmarks (which I’ll describe in a future post). At that time I was thinking of how Pub3D could scale to a multi-conformer version and I realized that the shape descriptors would allow me to easily visualize the “shape space” of a set of compounds. When these compounds are conformers for a molecule, one effectively gets a conformational envelope.
The shape descriptors characterize the 3D shape of a molecule in terms of 12 numbers. These numbers are simply the first three moments of four distance distrubutions. Each distribution is constructed from the distances of the atoms to a “special” point. For example, one of them is the centroid of the molecule. The calculation is certainly very fast and one can evaluate a “shape similarity” by evalutating the distance between the shape vectors of two molecules. (The CDK can evaluate these shape descriptors and compute similarities).
Getting back to Joe’s question, each molecule can be represented as a 12D point. Thus a collection of conformers will occupy a region in 12D space, whose minimum bounding rectangle (MBR) represents the “envelope” of the conformers. One can then consider conformers for multiple molecules and look at the overlap (or lack thereof) of the MBR’s. The overlap between the MBR’s of two molecules gives one an idea of the extent to which the shape of a molecule in a certain conformation is similar to that of another.
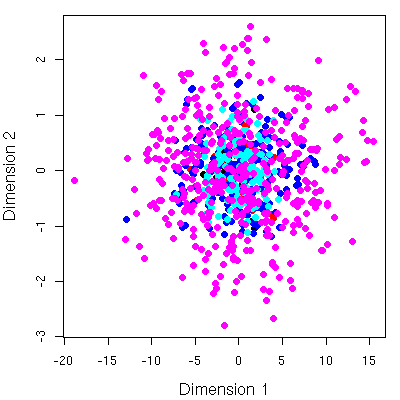
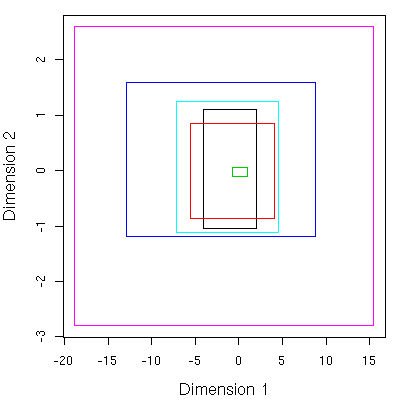
Of course, looking at stuff in 12D is not natural. To allow easy visualization I performed a multi-dimensional scaling using isoMDS converting the 12D points to 2D and evaluating the MBR’s. This leads to simple 2D plots. As an example, consider a plot of the shape descriptors for 6 molecules, scaled to 2D.Following that, we replace the points themselves with the MBR’s.
Given the spread of the points (or the size of the MBR), one can easily conclude that the conformational space of the molecules investigated are significantly different. But this is a trivial conclusions and doesn’t need this analysis. But one can then consider the overlap of the MBR’s or points and conclude that some of the conformations of different molecules are quite similar in shape.
Of course this method is rather indirect, and assumes that the shape descriptors are a faithful representation of the shape. One could also compare coformations by radius of gyration, though I think this approach provides more detail. Compared to something like ROCS, these descriptors are certainly much lower resolution. So there is a certain degree of inaccuracy. Might be useful to look at this a little more rigorously.

