This is a follow on to my previous post that described a recent paper where we explored a few ways to characterize the differential activity of small molecules in dose response screens. In this post I wanted to highlight some aspects of this type of analysis that didn’t make it into the final paper.
TL;DR there’s more to differential analysis of dose response data than thresholding and ranking.
Comparing Model Fits
One approach to characterizing differential activity is to test whether the curve fit models (in our case 4-parameter Hill models) are indistinguishable or not. While traditionally, ANOVA could be used to test this, it assumes that the models being compared are nested. This is not the case when testing for effects of different treatments (i.e., same model, but different datasets). As a result we first considered the use of AIC – but even then, applying this to the same model built on different datasets is not really valid.
Another approach (described by Ritz et al) that we considered was to refit the curves for the two treatments simultaneously using replicates, and determines whether the ratio of the AC50’s (termed the Selectivity Index or SI) from the two models was different from 1.0. We can then test the hypothesis and determine whether the SI was statistically significant or not. The drawback is that it, ideally, requires that the curves differ only in potency. In practice this is rarely the case as effects such as toxicity might cause a shift the in the response at low concentrations, partial efficacy might cause incomplete curves at high concentrations and so on.
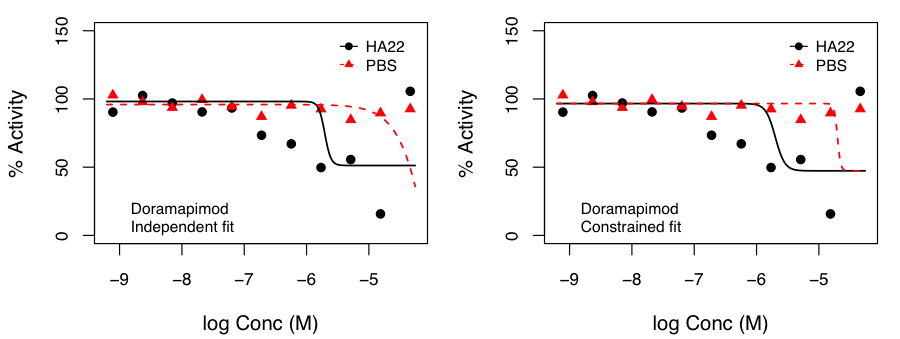 We examined this approach by fitting curves such that the top and bottom of the curves were constrained to be identical in both treatments and only the Hill slope and AC50 were allowed to vary.
After, appropriate correction, this identified molecules that exhibited p < 0.05 for the hypothesis that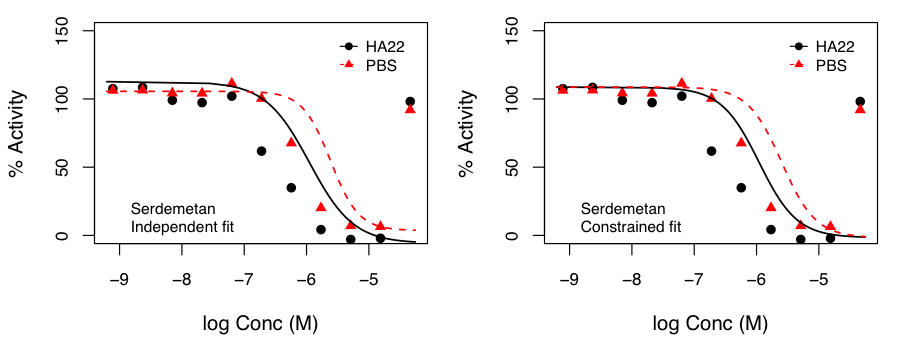 the SI was not 1.0. Independent and constrained curve fits for two compounds are shown alongside. While the constraint of equal top and bottom for both curves does lead to some differences compared to independent fits (especially from the point of view of efficacy), the current data suggests that the advantage of such a constraint (allowing robust inference on the statistical significance of SI) outweighs the disadvantages.
Variance Stabilization
Finally, given the rich literature on differential analysis for genomic data, our initial hope was to simply apply methods from that domain to the current problems. However, variance stabilization becomes an issue when dealing with small molecule data. It is well known from gene expression experiments that that the variance in replicate measurements can be a function of the mean value of the replicates. If not taken into account, this can mislead a t-test into identifying a gene (or compound, in our case) as exhibiting non-differential behavior, when in fact it is differentially expressed (or active).
The figure below compares the standard deviation (SD) versus mean of each compound, for each parameter in the two treatments (HA22, an immunotoxin and PBS, the vehicle treatment). Overlaid on the scatter plot is a loess fit. In the lower panel, we see that in the PBS treatment there is minimal dependency of SD on the mean values, except for the case of log AC50. However, for the case of HA22 treatment, each parameter shows a distinct dependence of SD on the mean replicate value.
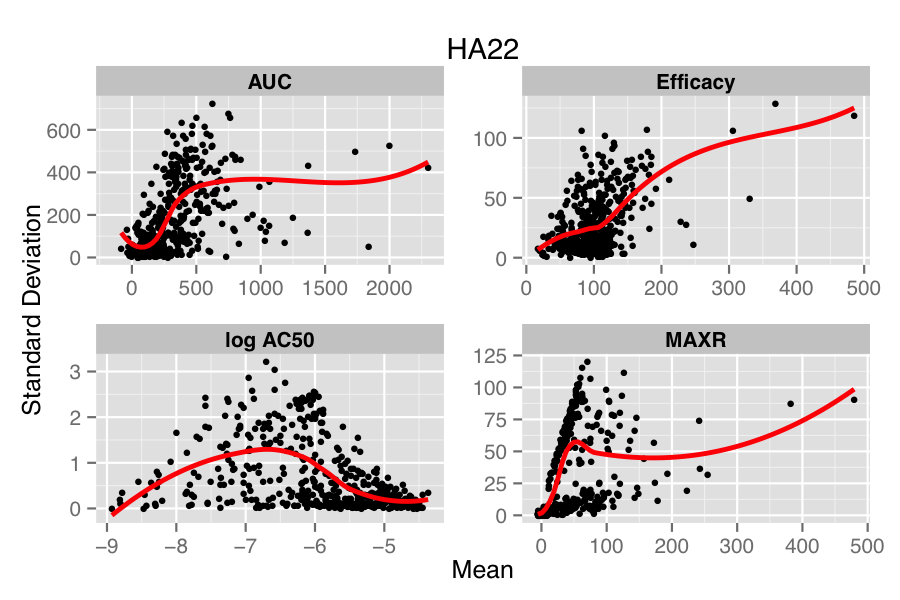
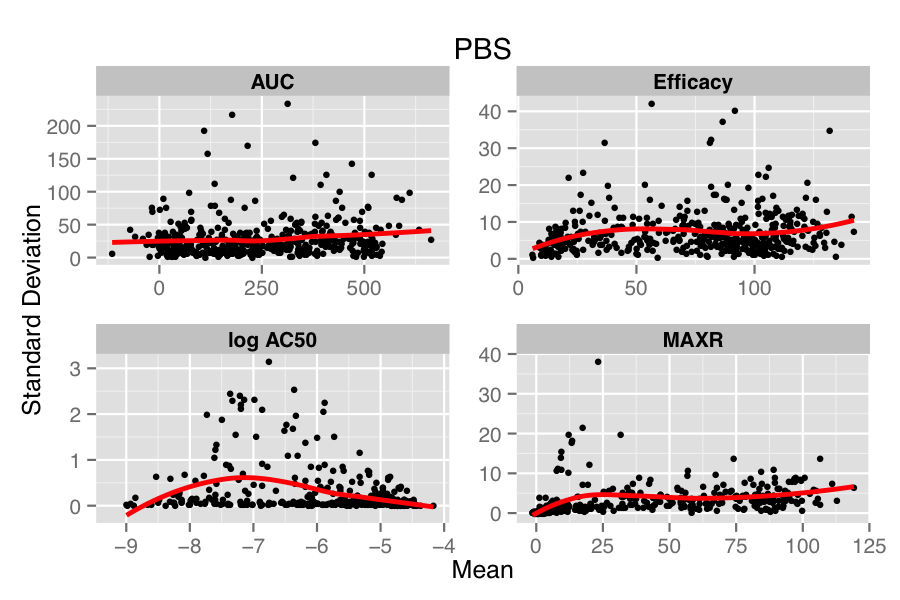
Many approaches have been designed to address this issue in genomic data (e.g., Huber et al, Durbin et al, Papana & Ishwaran). One of the drawbacks of most approaches is that they assume a distributional model for the errors (which in the case of the small molecule data would correspond to the true parameter value minus the calculated value) or a specific model for the mean-variance relationship. However, to our knowledge, there is no general solution to the problem of choosing an appropriate error distribution for small molecule activity (or curve parameter) data. A non-parametric approach described by Motakis et al employs the observed replicate data to stabilize the variance, avoiding any distributional assumptions. However, one requirement is that the mean-variance relationship be monotonic increasing. From the figure above we see that this is somewhat true for efficacy but does not hold, in a global sense, for the other parameters.
Overall, differential analysis of dose response data is somewhat of an open topic. While simple cases of pure potency or efficacy shifts can be easily analyzed, it can be challenging when all four curve fit parameters change. I’ve also highlighted some of the issues with applying methods devised for genomic data to small molecule data – solutions to these would enable the reuse of some powerful machinery.