UPDATE (3/21) – I was contacted by the author of the paper who pointed out that my analysis was based on a misunderstanding of the paper. Specifically
- The primary goal of WES is to identify actives – and according to the authors definition, the most interesting actives (that should be ranked highly) are those that have no dose response and show a constant activity equal to the positive control. Next in importance are compounds that exhibit a dose response. Finally the least interesting (and so lowest ranked) are those that show no dose response and are flat at the negative control level.
- The WES method requires that data be normalized such that DMSO (i.e., negative control) is at 0 and positive control is at 100%.
Since my analysis was based on the wrong normalization scheme the conclusions were erroneous. When the proper normalization is taken into account, the method works as advertised in that it correctly ranks compounds that show constant activity at the positive control level at the top, followed by curves with a dose response and finally with inactives (no activity at all) at the bottom.
Based on this I’ve updated the figures and text to correct my mistake. However, in my opinion, if the goal is to identify compounds that have a constant activity one does not need to go to entropy. In addition, for the case of compounds with a well defined dose response, the WES essentially ranks them by potency (assuming a valid curve fit). The updated text goes on to discuss these aspects.
UPDATE (2/25) – Regenerated the enrichment curves so that data was ranked in the correct order when LAC50 was being used.
I came across a paper that describes the use of weighted entropy to rank order dose response curves. As this data type is the bread and butter of my day job a simple ranking method is always of interest to me. While the method works as advertised, it appears to be a rather constrained method and doesn’t seem to do a whole let better than simpler, pre-existing approaches.
The paper correctly notes that there is no definitive protocol to rank compounds using their dose response curves. Such rankings are invariably problem dependent – in some cases, simple potency based ranking of good quality curves is sufficient. In other cases structural clustering combined with a measure of potency enrichment is more suitable. In addition, it is also true that all compounds in a screen do not necessarily fit well to a 4-parameter Hill model. This may simply be due to noise but could also be due to some process that is better fit by some other model (bell or U shaped curves). The point being that rankings based on a pre-defined model may not be useful or accurate.
The paper proposes the use of entropy as a way to rank dose response curves in a model-free manner. While a natural approach is to use Shannon entropy, the author suggests that the equal weighting implicit in the calculation is unsuitable. Instead, the use of weighted entropy (WES) is proposed as a more robust approach that takes into account unreliable data points. The author defines the weights based on the level of detection of the assay (though I’d argue that since the intended goal is to capture the reliability of individual response points, a more appropriate weight should be derived from some form of variance – either from replicate data or else pooled across the collection) . The author then suggests that curves should be ranked by the WES value, with higher values indicating a better rank.
For any proposed ranking scheme, one must first define what the goal is. When ranking dose response curves are we looking for compounds
- that exhibit well defined dose response (top and bottom asymptotes, > 80% efficacy etc)?
- good potency, even if the curve is not that well fit?
- compounds with a specific chemotype?
According to the paper, a key goal is to be able to identify compounds that show a constant activity – and within such compounds the more interesting ones are those that have constant activity = 100%. While I disagree that these are the most interesting compounds, it is not clear why one would need an entropy based method to identify such constant-activity curves (either at 100% or 0%).
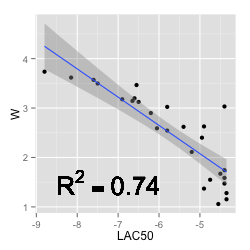 More generally, for well defined dose response curves, the WES, by definition, tracks potency. This can be seen in the figure alongside that plots the WES value vs the log AC50 for a set of 27 good quality curves taken from a screen of 1408 AR agonists. Granted, when no model can be fit, one does not have an AC50, whereas a WES can be evaluated. But in such a case it’s not clear why one would necessarily want to quantify presumably noisy data.
However, going along with the authors definition, the method does distinguish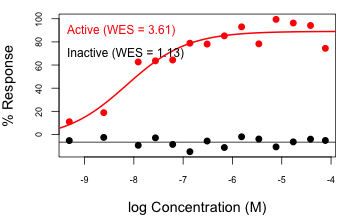 valid dose responses from inactives (though again, one does not require entropy to make such a distinction!) as shown in the adjoining figure. It is clear from the definition of WES that a curve that is flat at 100% will exhibit the maximum value of WES and so will always rank high.
One way to to test the performance of ranking methods this is to take a collection of curves, rank them by a measure and identify how many actives are identified in the top N% of the collection, for varying N. Ideally, a good ranking would identify nearly all the actives for a small N. If the ranking were random one would identify N% of the actives in the top N% of the collection. Here an active is defined in terms of curve class, a heuristic that we use to initially weed out poor quality curves and focus on good quality ones. I defined active as curve classes 1.1, 1.2, 2.2 and 2.1 (see here for a summary of curve classes).
As pointed out by the author during our conversation, this is not an entirely fair comparison – since my scheme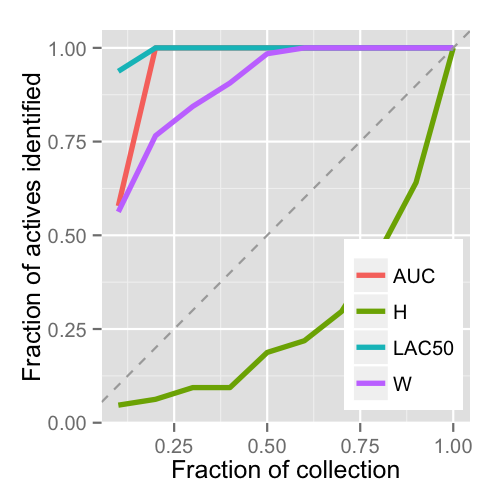 does not consider a flat curve at 100% as active. Though it’s a valid point, the dataset I worked with did not have any such curves. More generally, such curves would be the exception in a qHTS screen (assuming the concentration ranges have been correctly chosen). From that point of view, one should be able to apply WES to generate a ranking for any qHTS screen otherwise one would have to inspect the curves first to ensure that it contains such “flat actives” and then apply WES. Which is not the right way to go about it.
As shown in the enrichment plot shown alongside (generated for the 1408 compound AR agonist dataset), WES works better than random (and much better than the standard Shannon entropy), but is still outperformed by the area under the dose response curve (AUC) and potency. I certainly don’t claim that AUC is a completely robust way to rank dose response curves (in fact for some cases such as invalid curve fits, it’d be nonsensical). I also include LAC50, the logarithm of the AC50, as a ranking method simply because the paper considers it a poor way to rank curves (which I agree with, particularly if one does not first filter for good quality, efficacious curves).
There are a few other issues, though I think the most egregious one was that the method was tested on just one dataset. I’m not convinced that a single dataset represents a sufficient validation (given that Tox21 has about 80 published bioassays in PubChem). But that’s a case of poor reviewing rather than a technical flaw.
you’ve got a few dead links – http://assay.nih.gov/curveclass.pdf for starters
The images are not showing up, unfortunately.
Images should be back now